Programming Projects
- Home
- Programming Projects
Objective: Build a basic simulation of a researcher-focused social network, using object-oriented programming and data structures to handle user profiles, relationships, and intelligent connection recommendations.
Key Components:
-
- Profile Management System: Created a custom class to represent researcher profiles with details like name, email, research interests, and past experience.
-
- Data Structuring with BST: Used a Binary Search Tree to store and retrieve profiles efficiently, allowing quick lookup and alphabetical navigation.
-
- Graph-Based Connections: Designed a graph to simulate follower/following relationships between researchers and model their network structure..
-
- File Integration: Developed a file reader to import profile data from structured text files and populate the system automatically.
-
- Alphabetical Sorting Mechanism: Implemented a sorting mechanism to help users browse profiles in a structured, organized way.
-
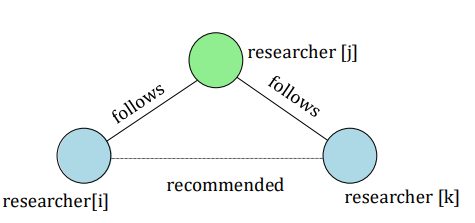
- Follower Recommendations: Implemented a simple recommendation system using the triadic closure principle—suggesting new connections based on shared contacts.
Key Outcomes:
-
- Learned how to combine OOP, BSTs, and graphs into a cohesive tool that mirrors real-world systems like LinkedIn or ResearchGate.
- Practiced thinking in terms of data relationships, not just data points—crucial for systems that grow over time.
-
The project showed potential for low-resource academic platforms that focus on discoverability, collaboration, and profile clarity.
Explore More: Visit the project repository on GitHub for detailed insights: Researcher’s Network on GitHub
Hydro-Power Allocation Optimization Model
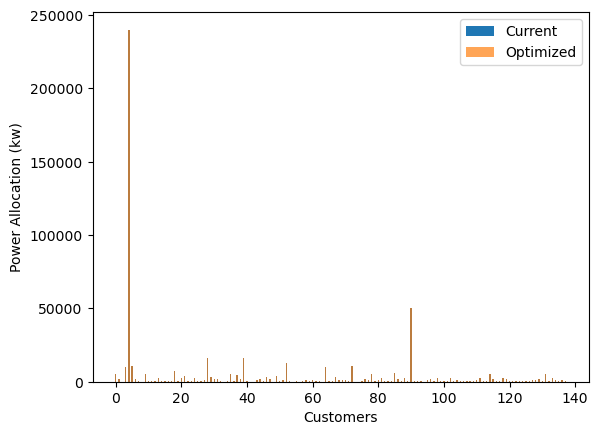
Objective: To build a tool that helps energy planners understand how different hydro-power allocation decisions could affect job creation. The goal was to use data—not just assumptions—to support smarter policy and resource planning.
Methodology:
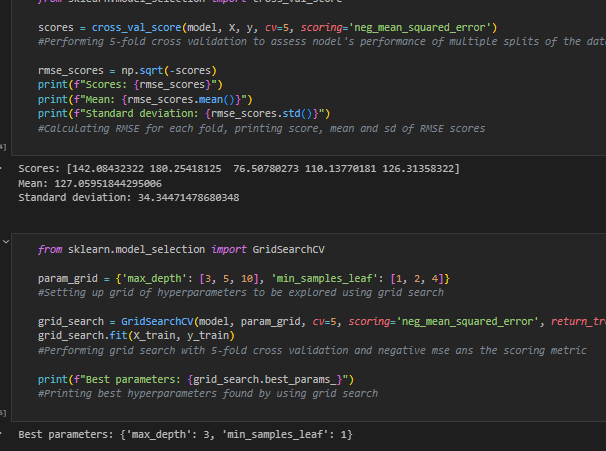
- Model Development: I trained a decision tree regression model to predict the number of jobs generated based on power allocation levels across regions. This allowed for more targeted and outcome-driven energy planning.
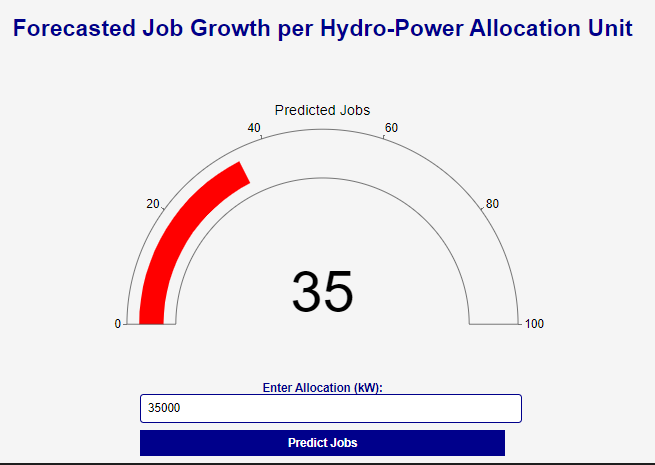
- Dashboard Build: To make the insights accessible, I created an interactive dashboard that let users input different allocation values and instantly see the projected impact on job creation.
- Data Focus: The project leaned on publicly available economic and energy datasets to tie power distribution directly to employment projections.
Key Outcomes:
- Predictive Insights: The model produced clear forecasts of job growth potential based on how hydro resources were distributed—helpful for planning both energy output and economic development.
- Visual Clarity: The dashboard turned raw data into something usable and decision-friendly, especially for non-technical stakeholders.
- Scalable Framework: While built around hydro-power, the same approach could be adapted to other resource allocation challenges—like budgeting, healthcare access, or education.
- Contribution & Future Scope: This project showed how machine learning can translate technical data into actionable insights for public good. It was a hands-on exercise in combining predictive modeling with human-centered design to support smarter, more transparent decisions. Future iterations could expand to include multi-resource tradeoffs or deeper regional modeling.
Explore More: Visit the project repository on GitHub for detailed insights: Hydro-Power Allocation and Economic Impact Analysis on GitHub
Temperature Monitoring System
Objective: This project was inspired by time I spent in Sri Lanka, where I saw firsthand how factory workers often dealt with poor ventilation and extreme temperature swings caused by heavy machinery. I wanted to create a simple, affordable system that could help stabilize indoor conditions and improve day-to-day comfort on the factory floor.
Methodology:
Problem Focus: Build a simple, low-cost temperature monitoring and control system to help maintain a more comfortable environment for workers and improve overall productivity.
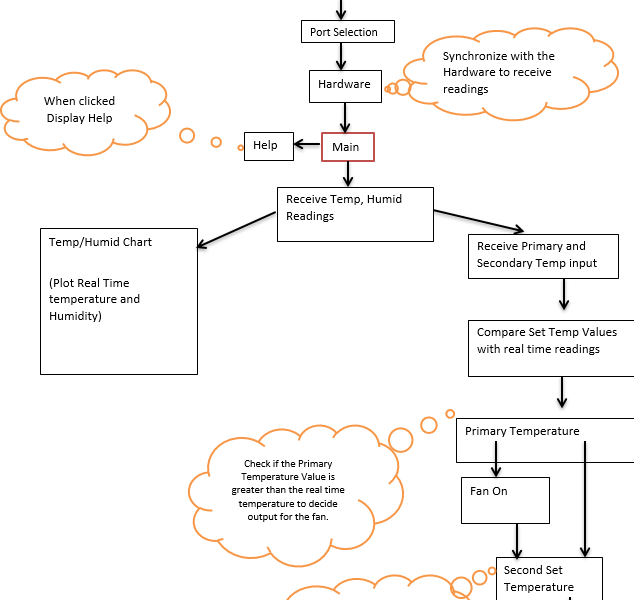
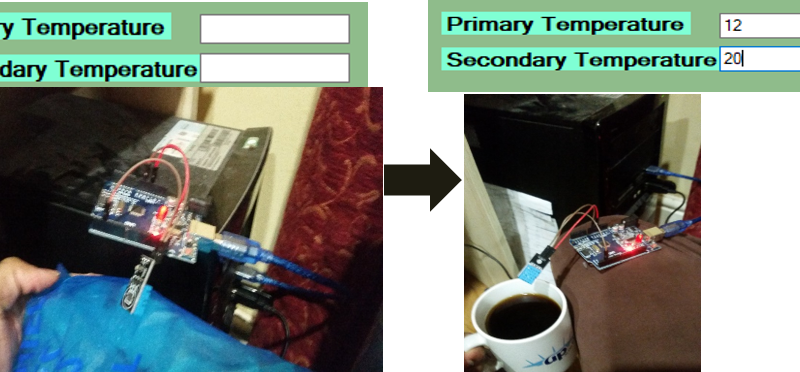
Hardware & Software: Used temperature and humidity sensors alongside a desktop application with a graphical user interface (GUI) to track real-time conditions and trigger alerts.
Programming & Visualization: Sensor data was visualized through live graphs showing trends throughout the day. A divide-and-conquer programming approach made the system modular and easy to maintain.
Solution Design: Proposed a basic feedback loop that used the sensor data to regulate environmental conditions automatically — with potential to activate fans or alerts based on set thresholds.
Key Outcomes:
- Energy-Smart Design: The system can maintain optimal working temperatures across different shifts while reducing unnecessary cooling — saving energy and costs.
- Worker Comfort & Focus: More stable conditions meant fewer productivity dips due to heat spikes, which workers reported positively during testing.
- Live Monitoring & Alerts: Management could monitor readings from a single dashboard, set custom thresholds, and receive alerts to take action — no guesswork involved.
- Contribution & Future Scope: This project can be scaled to support remote monitoring and more advanced automation. It’s a cost-effective blueprint for factories in similar climates looking to improve work conditions without large capital investments.
Explore More: Visit the project on GitHub for a comprehensive understanding of its development and functionality: Temperature Monitoring System
Land Cover Insights: SVM vs. CNN
Objective: To Build a machine learning system to classify land cover types (like urban, forest, farmland, etc.) from satellite imagery using a combination of supervised and unsupervised learning models..
Key Components:
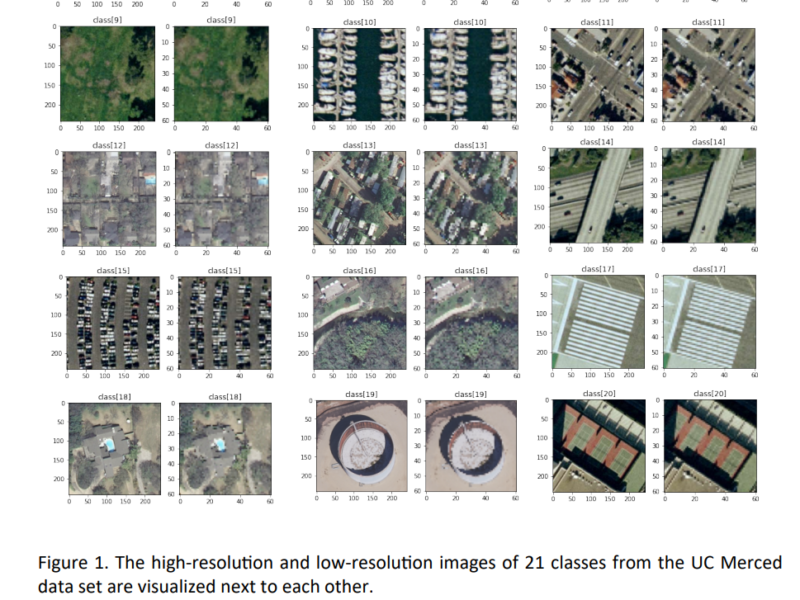
- Dataset: Used the UC Merced Land Use Dataset — 2,100 images across 21 land use categories. These included both high- and low-resolution RGB images.
- Methodology:
- Data Handling: Split images into 80% training, 10% validation, and 10% testing sets..
- Feature Extraction : Focused on Histogram of Oriented Gradients (HOG) to capture shape and texture data.
- Algorithms Used: Applied a range of models — K-Means, Gaussian Mixture Models, Support Vector Machines (SVM), and Neural Networks.
- Model Evaluation: Used confusion matrices and accuracy metrics to assess each model’s performance.
Key Outcomes:
- Strong Classification Performance: Best results came from the SVM model paired with HOG features.
- Pattern Discovery: Revealed useful land use patterns that could inform urban planning or environmental studies.
- Transferable Techniques: Demonstrated how simple feature extraction + ML can be applied to problems like crop detection or mapping urban expansion.
Explore More: For a detailed exploration of the project’s methodology and findings, visit the GitHub repository: Land Cover Detection Project.
Solarwise Hybrid Solar Forecasting Model
Objective: Improve the accuracy of short-term solar energy (PV) forecasts by predicting how different cloud conditions affect output — helping solar operators better manage grid integration..
Methodology:
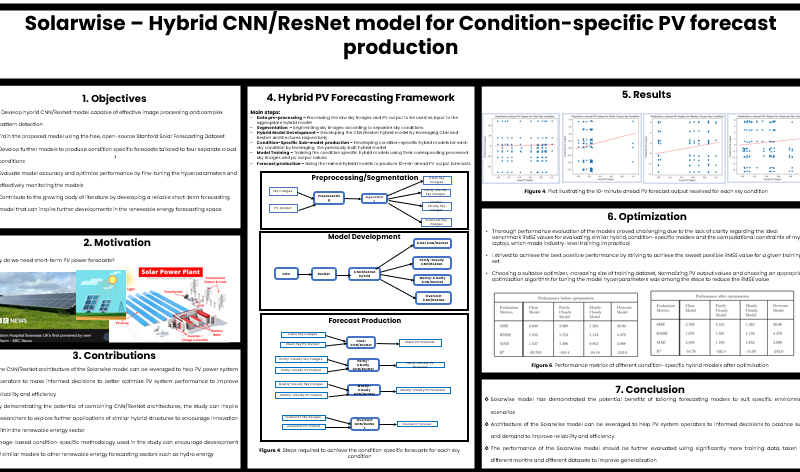
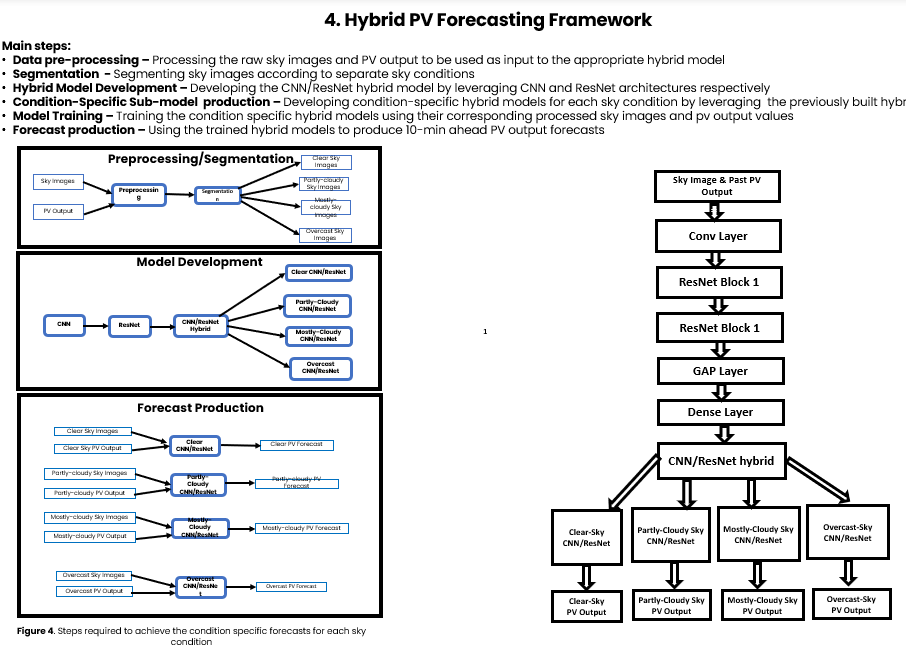
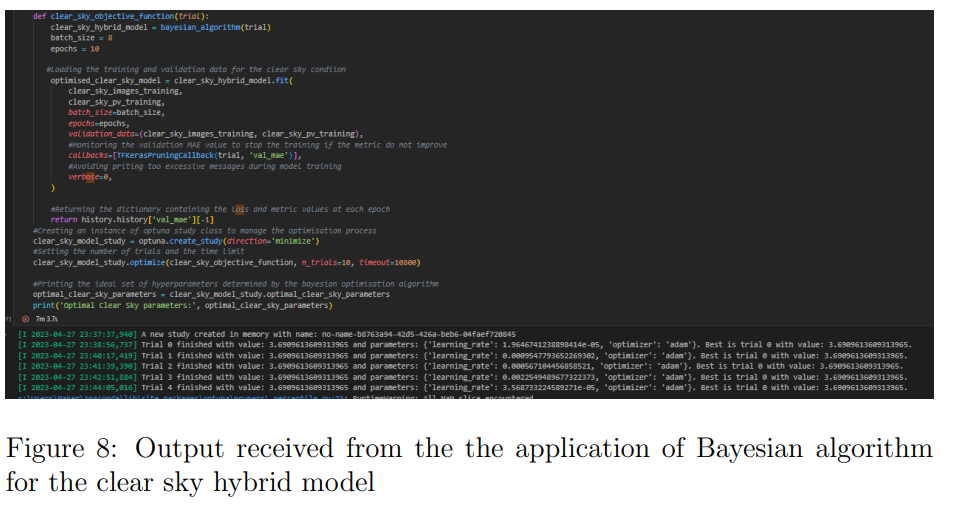
Hybrid CNN/ResNet Model: Trained a hybrid neural network that combined image analysis (CNN) with time-sensitive data modeling (ResNet) to predict solar output based on sky condition images.
Condition-Specific Forecasting: Built separate sub-models to handle four distinct weather types — clear, partly cloudy, mostly cloudy, and overcast. varying sky conditions.
Data & Training: Used 600 labeled sky images from Stanford’s dataset. The model was trained to make 10-minute-ahead PV output forecasts.
Key Outcomes:
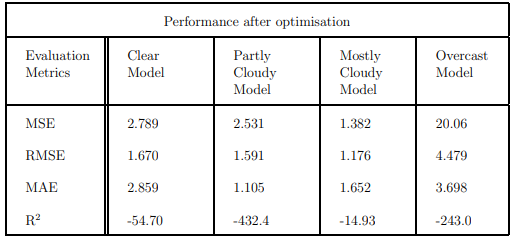
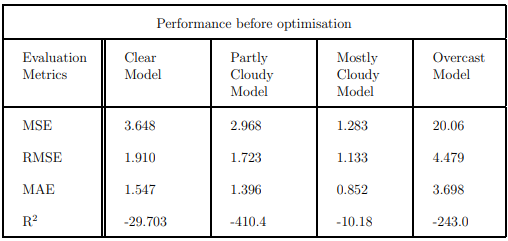
Achieved Root Mean Squared Error (RMSE) values as follows: Clear (1.91), Partly-cloudy (1.72), Mostly-cloudy (1.13), and Overcast (4.48). The model excelled with mostly-cloudy conditions but faced challenges with overcast scenarios, likely due to the unpredictability of dense cloud cover.
Contribution & Future Scope: This hybrid approach could help solar operators better plan energy usage under changing weather conditions. With added meteorological inputs (like wind speed or humidity), the model could evolve into a real-time forecasting tool with broader applications in smart grid systems.
Explore More: For a detailed overview of the project’s development and methodology, visit the GitHub repository: Solarwise Project on GitHub


